Analytics
Track your store's performance with comprehensive web traffic and sales analytics.
Web Traffic Analytics (Dashboard Home)
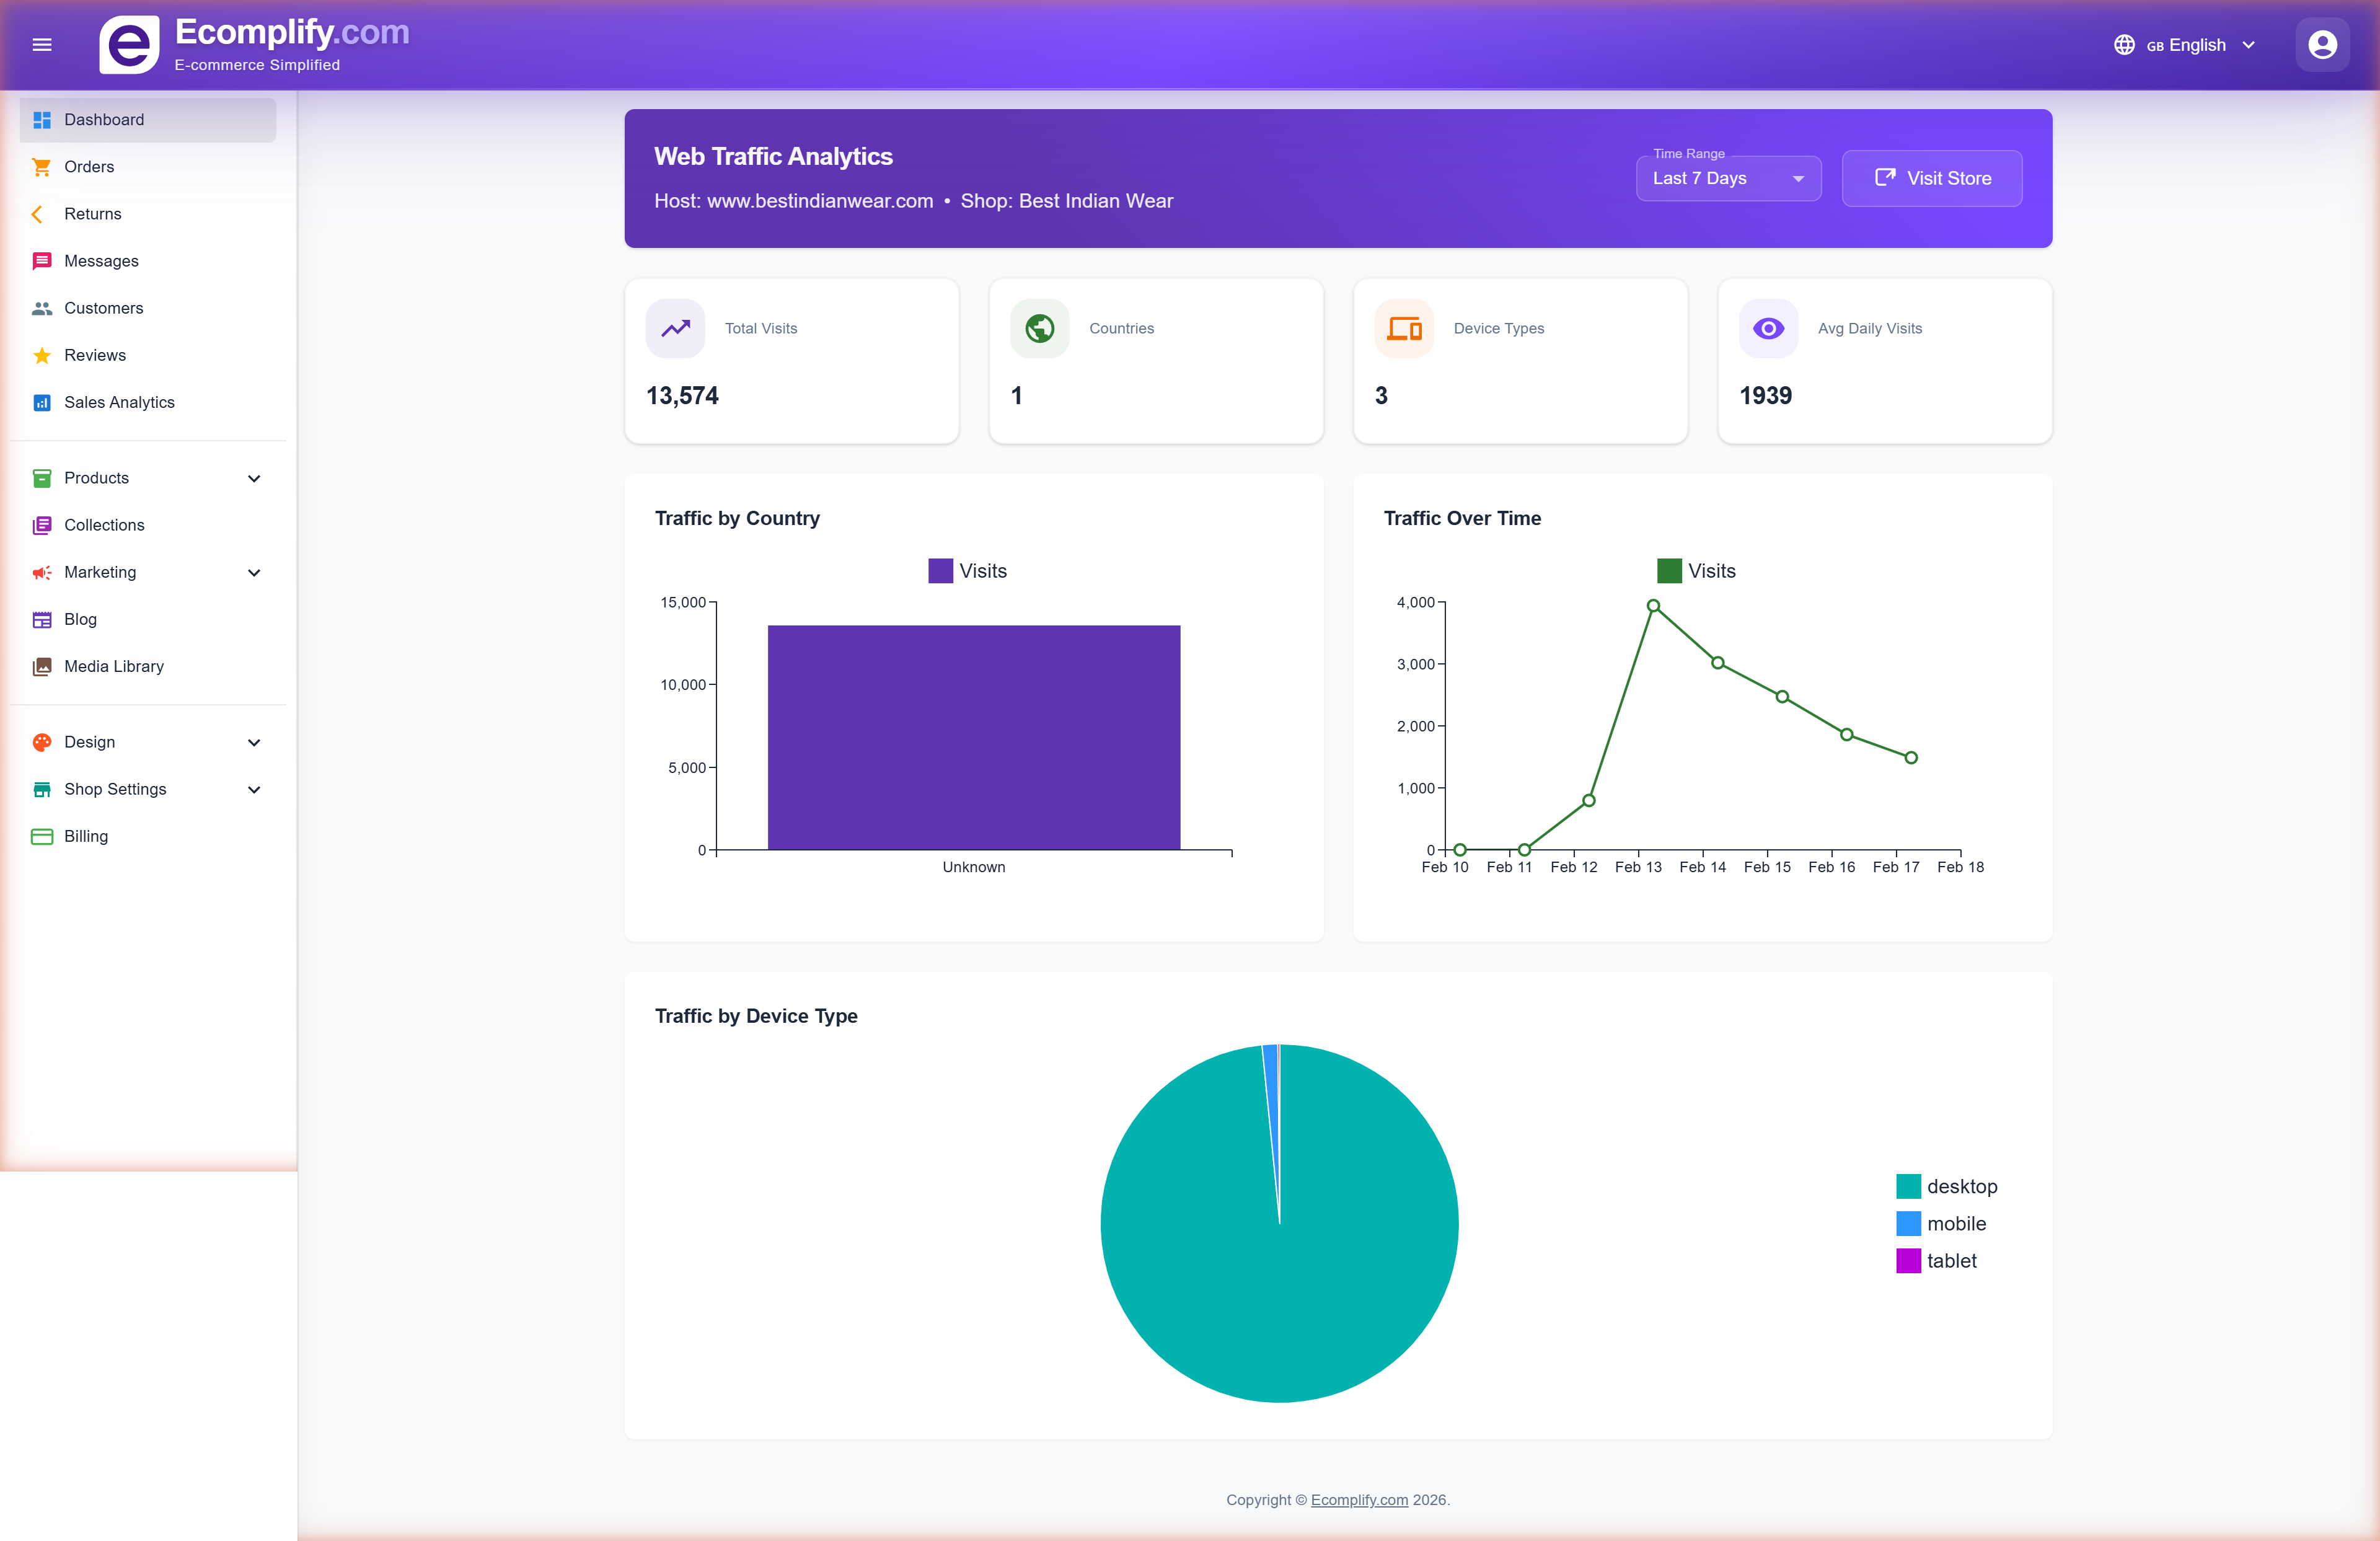
The Dashboard home page shows real-time web traffic data for your storefront.
Key Metrics
- Total Visits - Total number of storefront visits
- Countries - Number of countries visitors come from
- Device Types - Desktop, mobile, and tablet breakdown
- Avg Daily Visits - Average visits per day
Charts
- Traffic by Country - Bar chart showing visits by country
- Traffic Over Time - Line chart showing visit trends over the selected period
- Traffic by Device Type - Pie chart showing desktop vs. mobile vs. tablet split
Time Range
Use the time range selector to view data for:
- Last 7 days
- Last 15 days
- Last 30 days
Sales Analytics
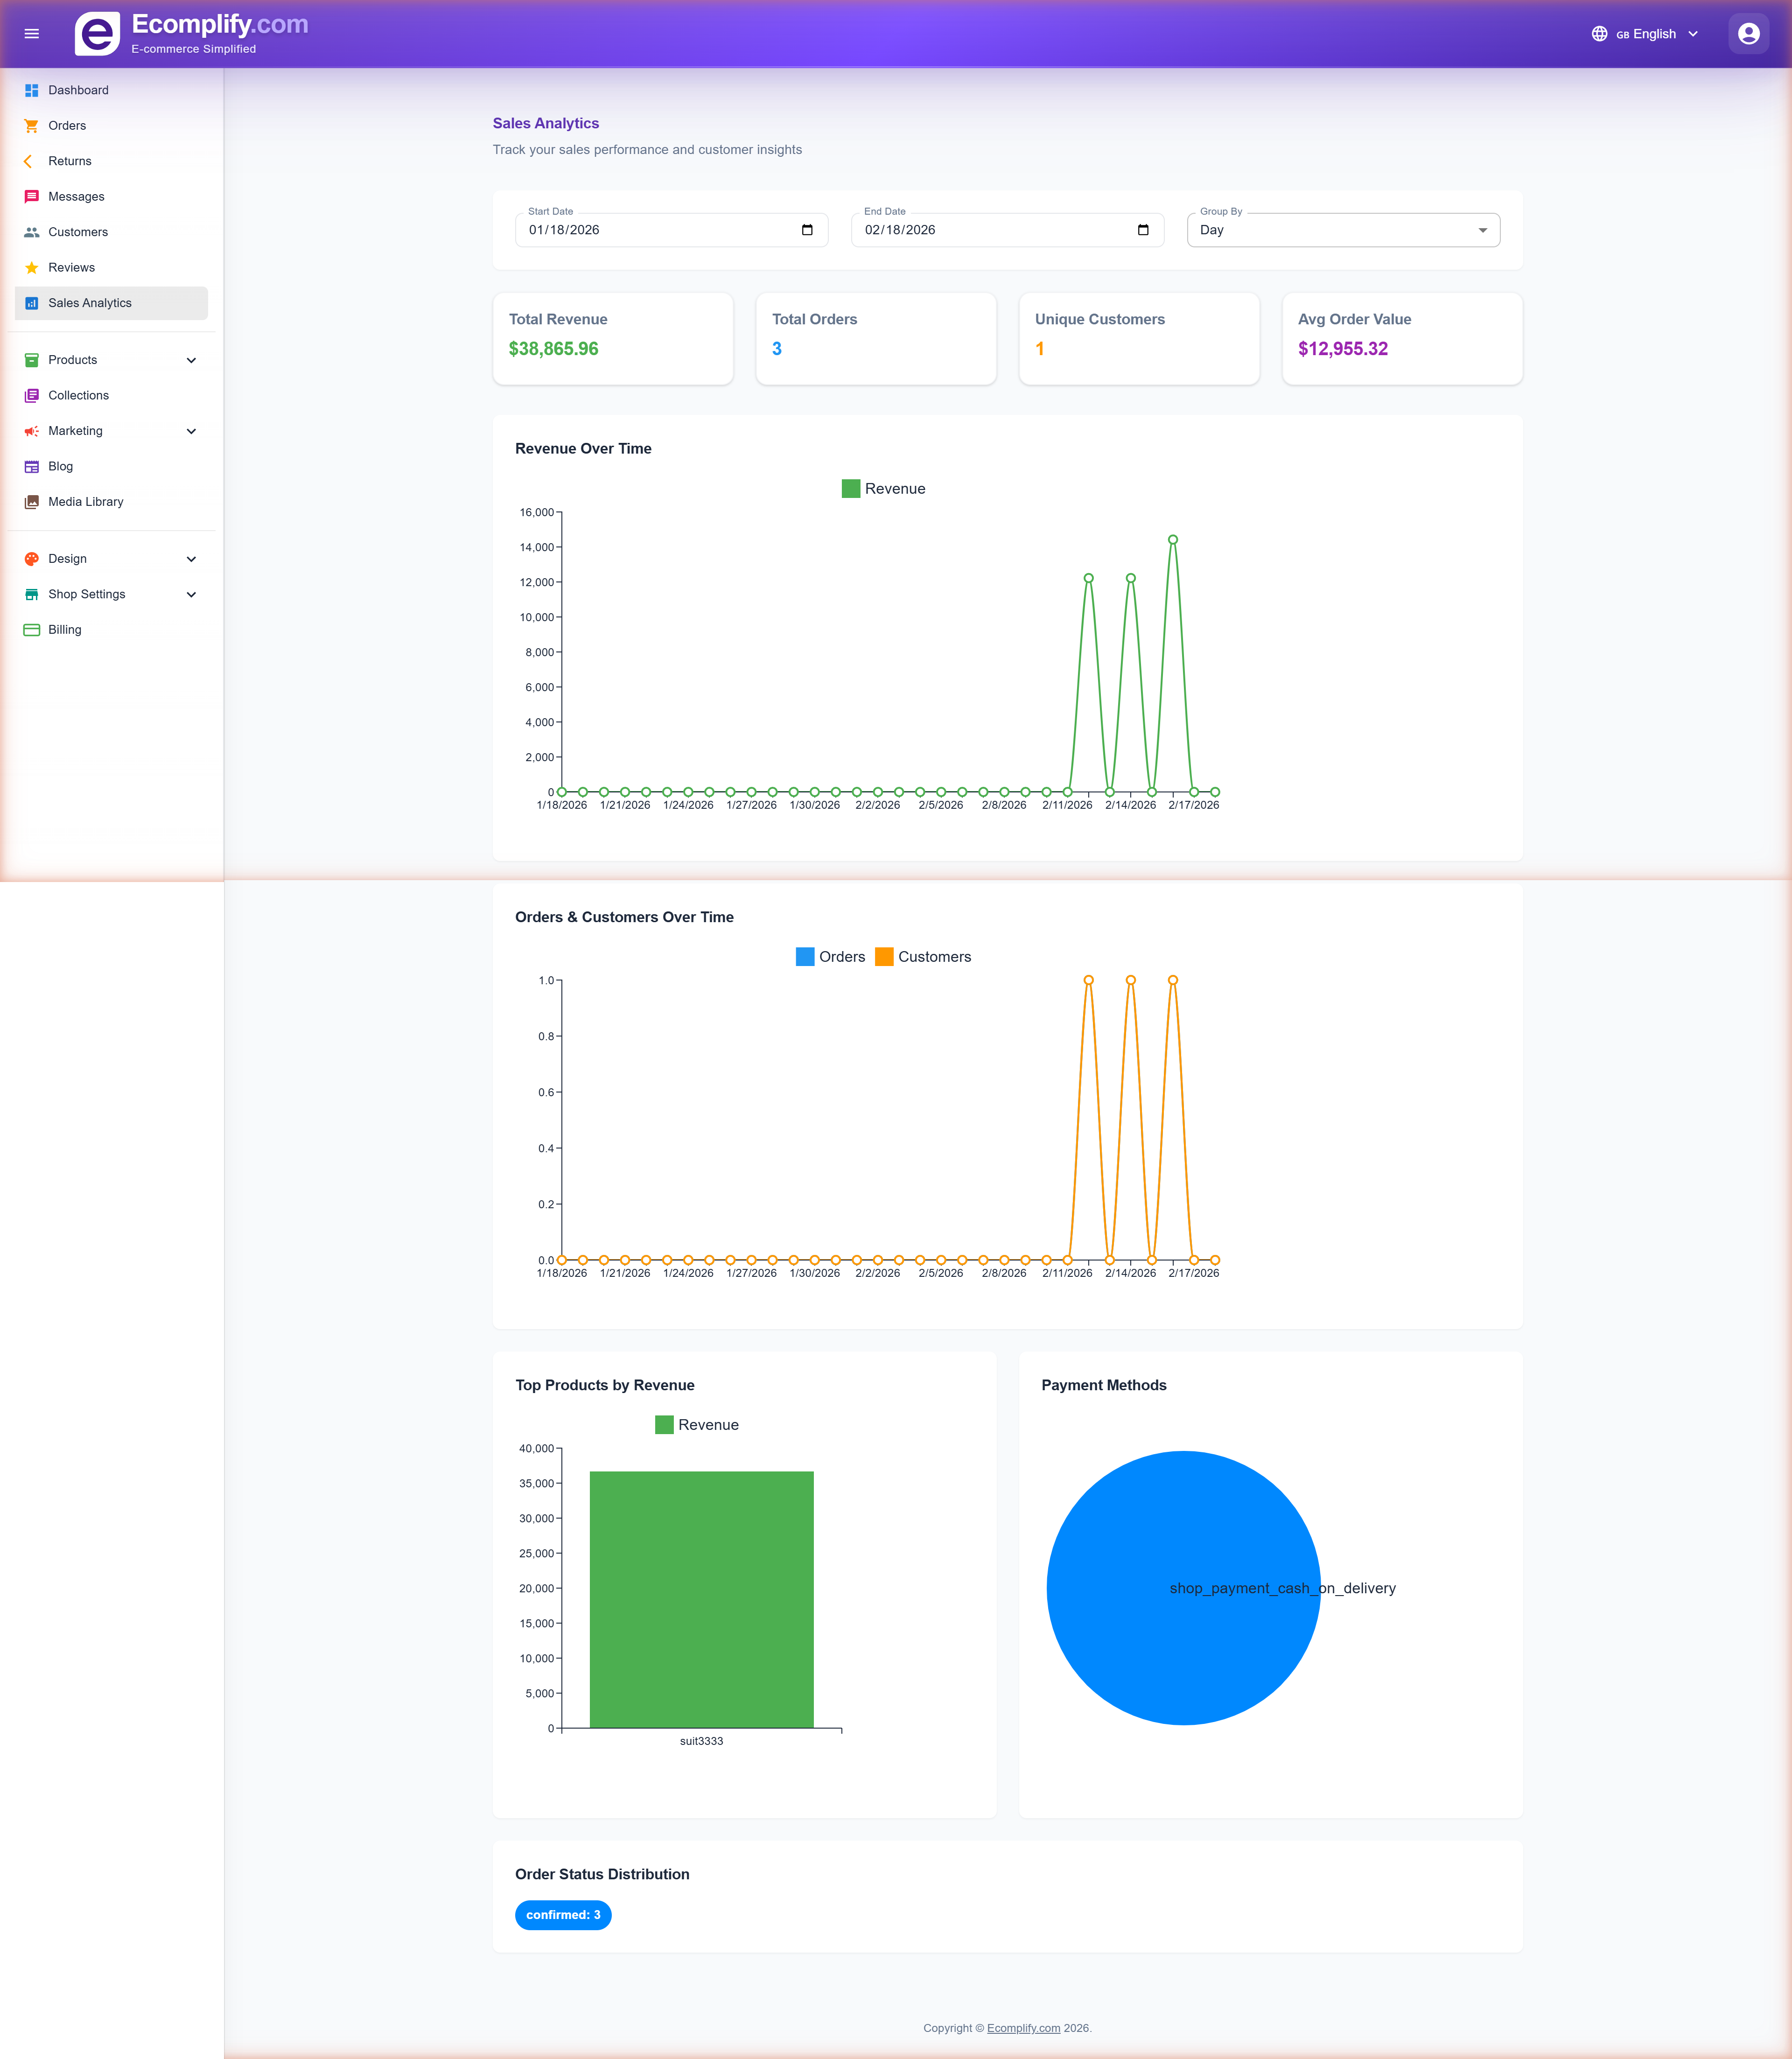
Navigate to Sales Analytics for detailed revenue and business insights.
Summary Metrics
- Total Revenue - Sum of all order amounts in the selected period
- Total Orders - Number of orders placed
- Unique Customers - Number of distinct customers who ordered
- Avg Order Value - Average amount per order
Date Range & Grouping
- Set custom Start Date and End Date
- Group data by Day, Week, or Month
Revenue Over Time
Line chart showing revenue trends over the selected period. Helps identify peak sales days and seasonal patterns.
Orders & Customers Over Time
Dual-line chart comparing:
- Orders (blue) - Number of orders per period
- Customers (orange) - Number of unique customers per period
Top Products by Revenue
Bar chart showing your best-selling products ranked by revenue generated.
Payment Methods
Pie chart showing the distribution of payment methods used by customers (Cash on Delivery, Stripe, Razorpay, etc.).
Order Status Distribution
Visual breakdown of order statuses (Confirmed, Pending, Cancelled, etc.) to help identify fulfillment bottlenecks.